跟着顶刊学分析之单细胞组学结合统计方法解析分布差异

Xing Abao Lv3

本示例参考Tissue-resident memory CD8 T cell diversity is spatiotemporally imprinted

本文的分析方法和可视化技巧非常值得在单细胞空间转录组研究中借鉴和应用。使用模块设计,将功能分解为多个可复用的函数,全名分析单细胞空间转录组数据,从基因表达到空间关系,再到分组比较。

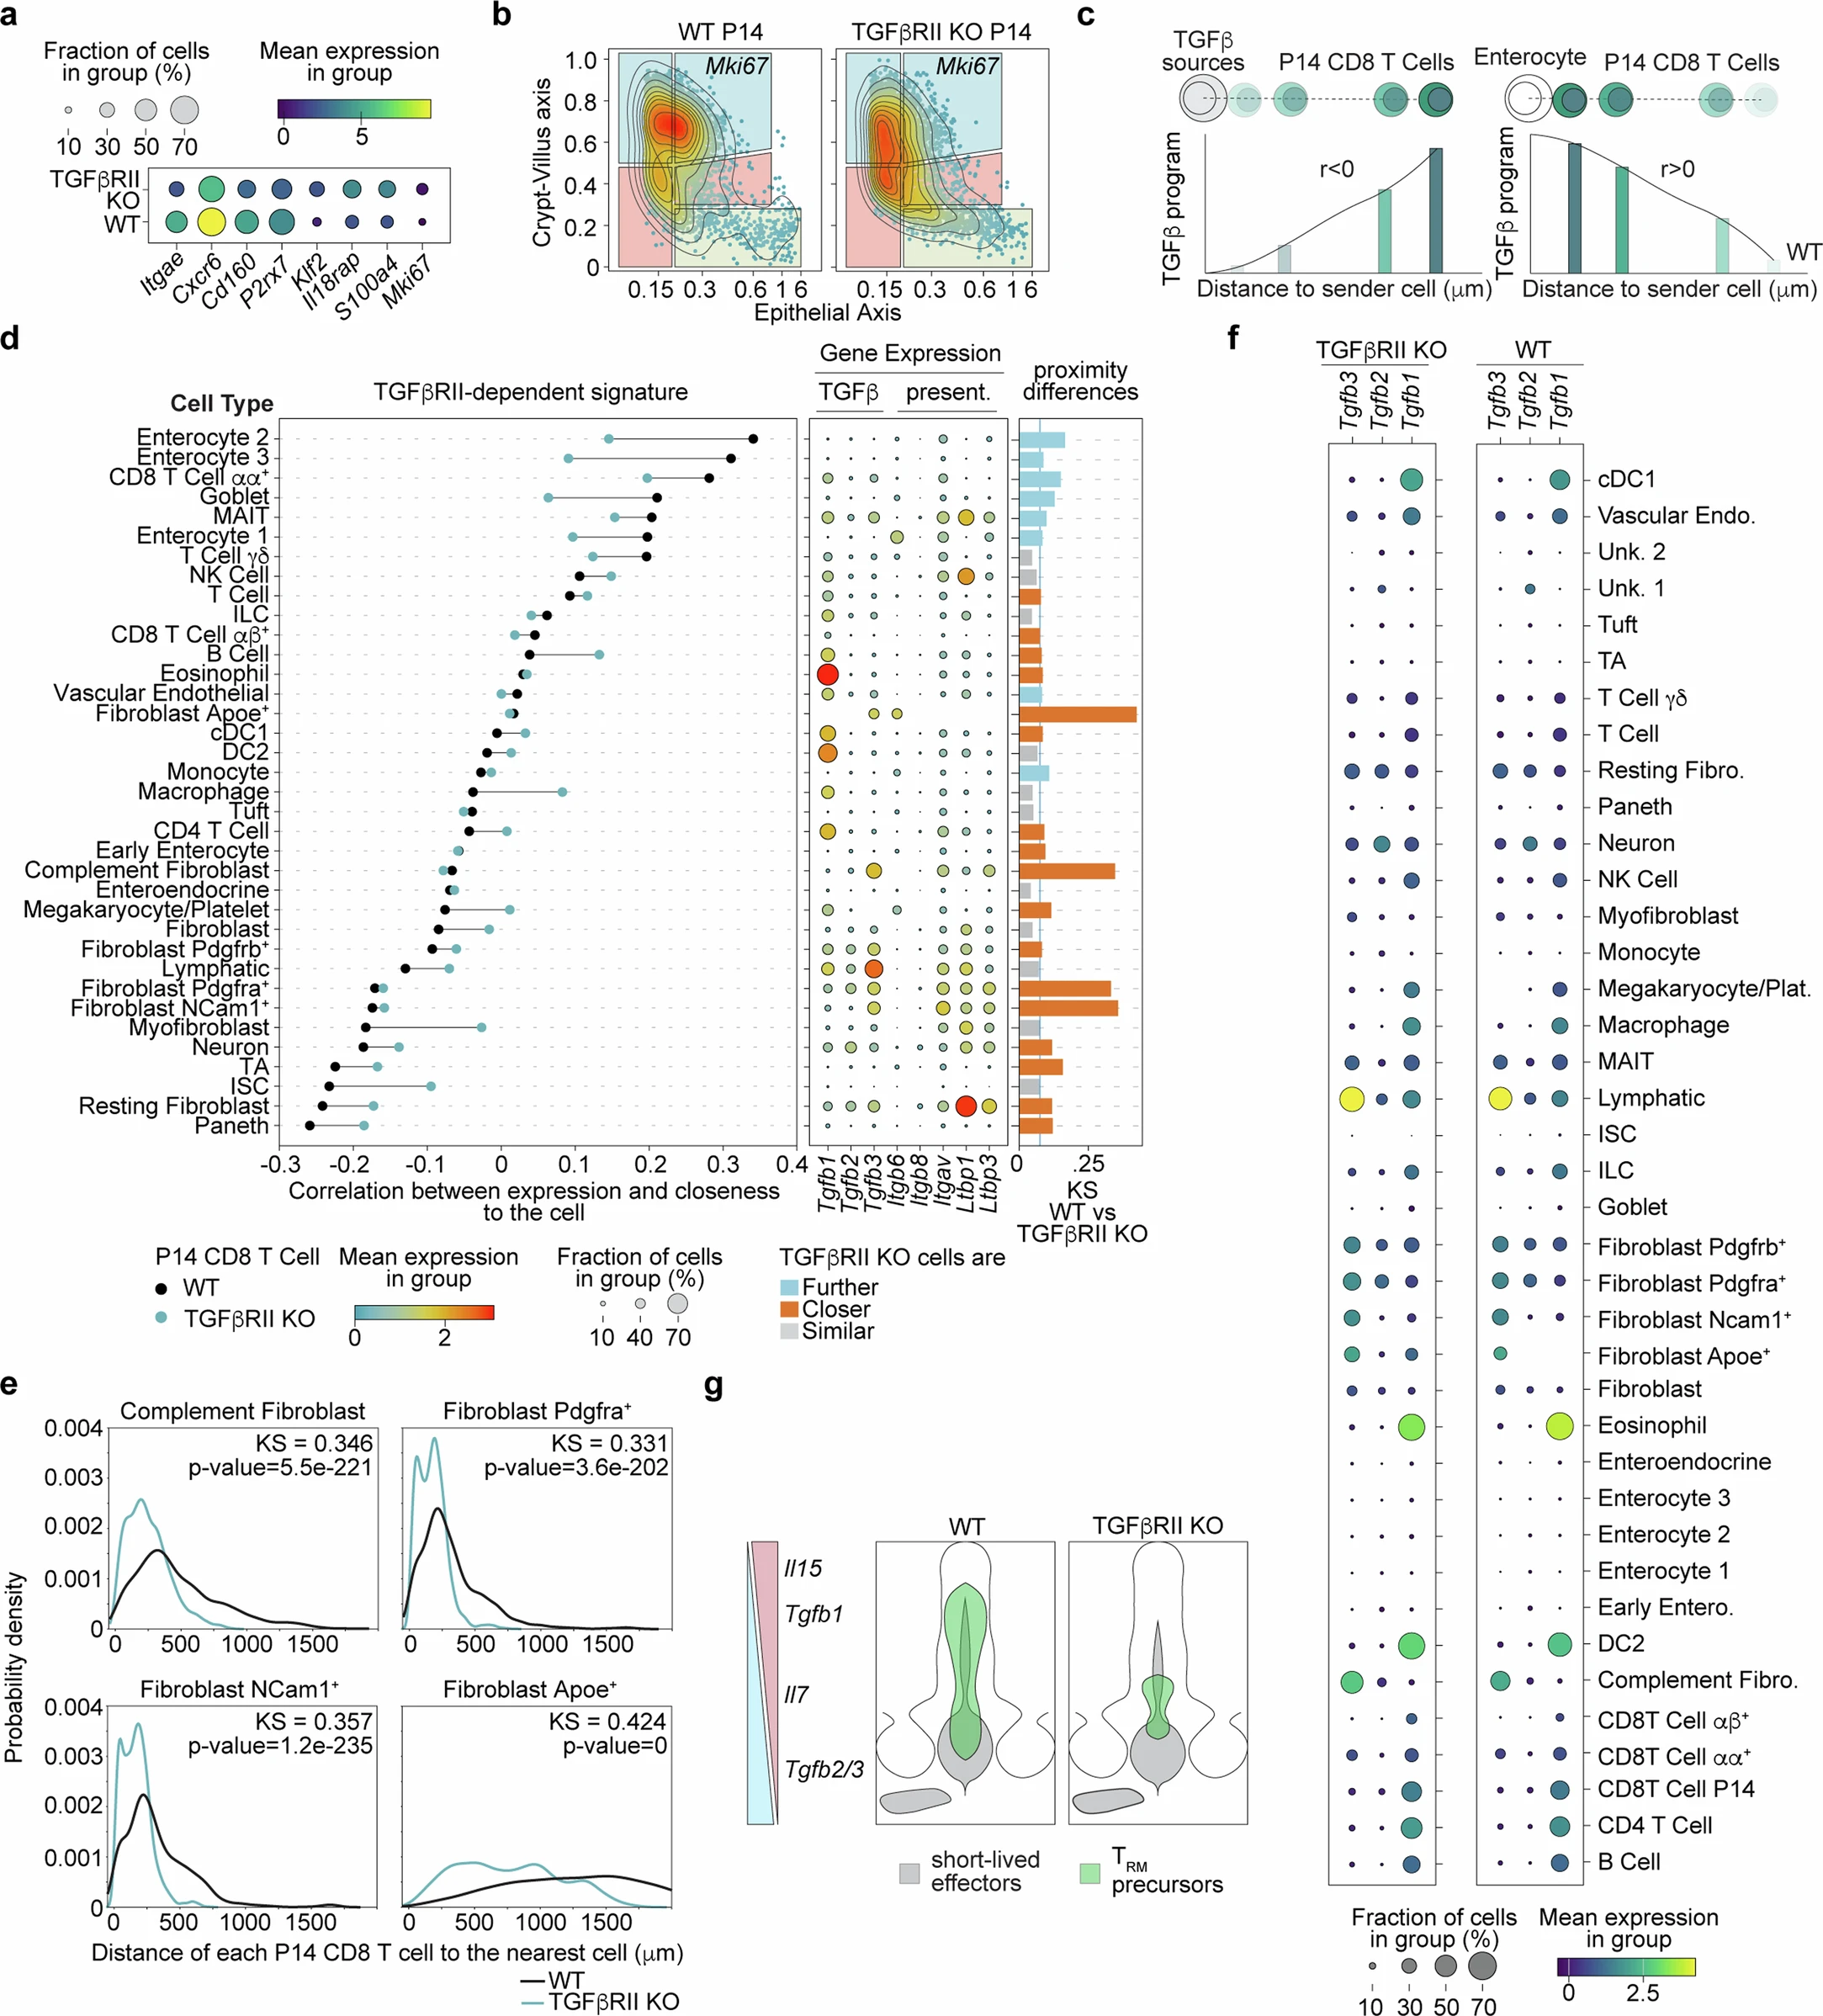
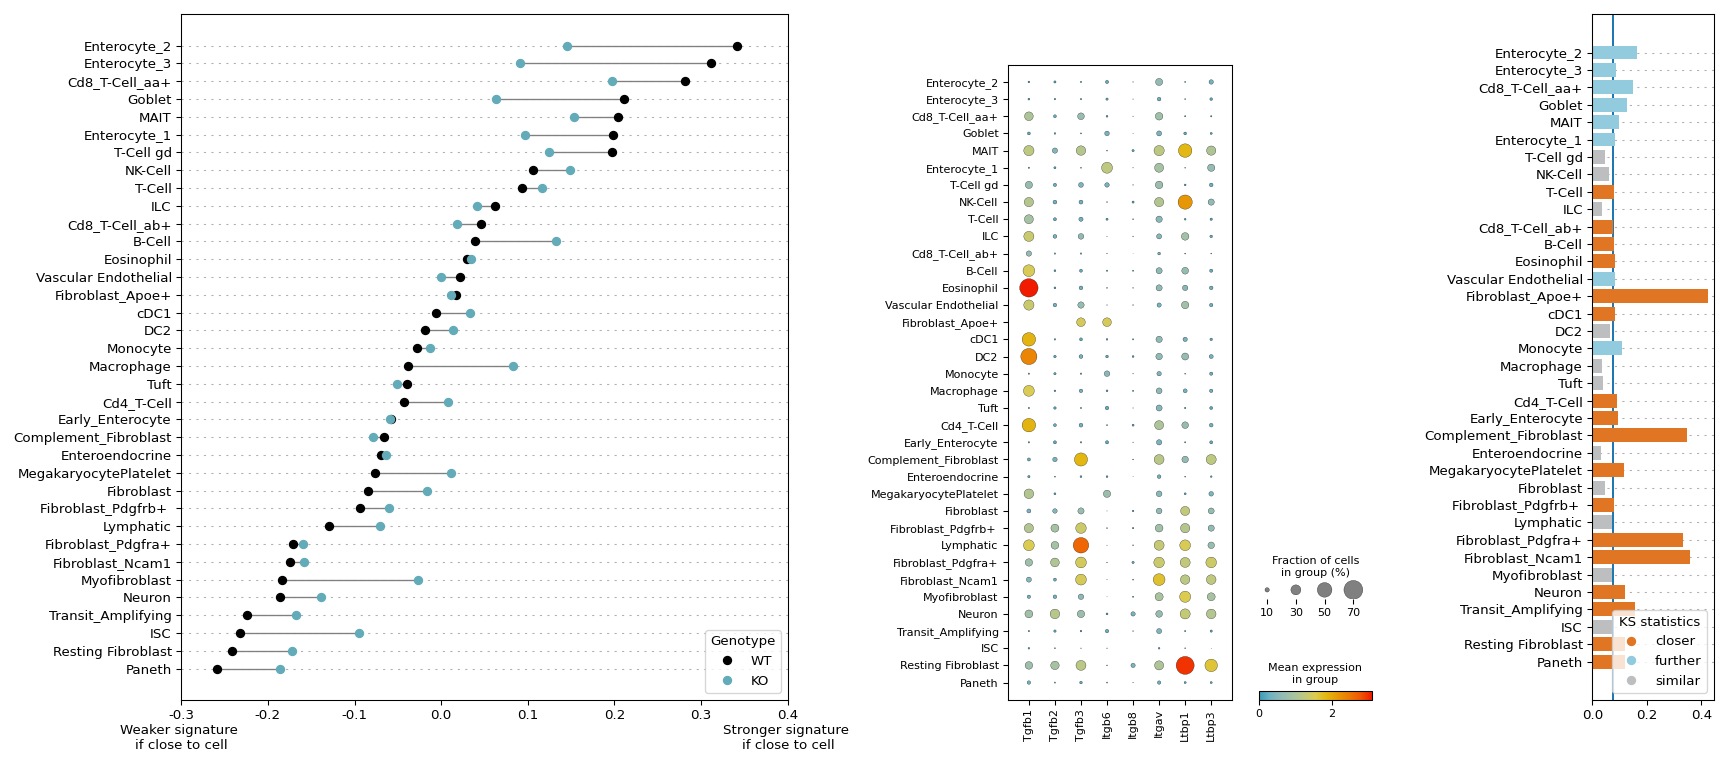
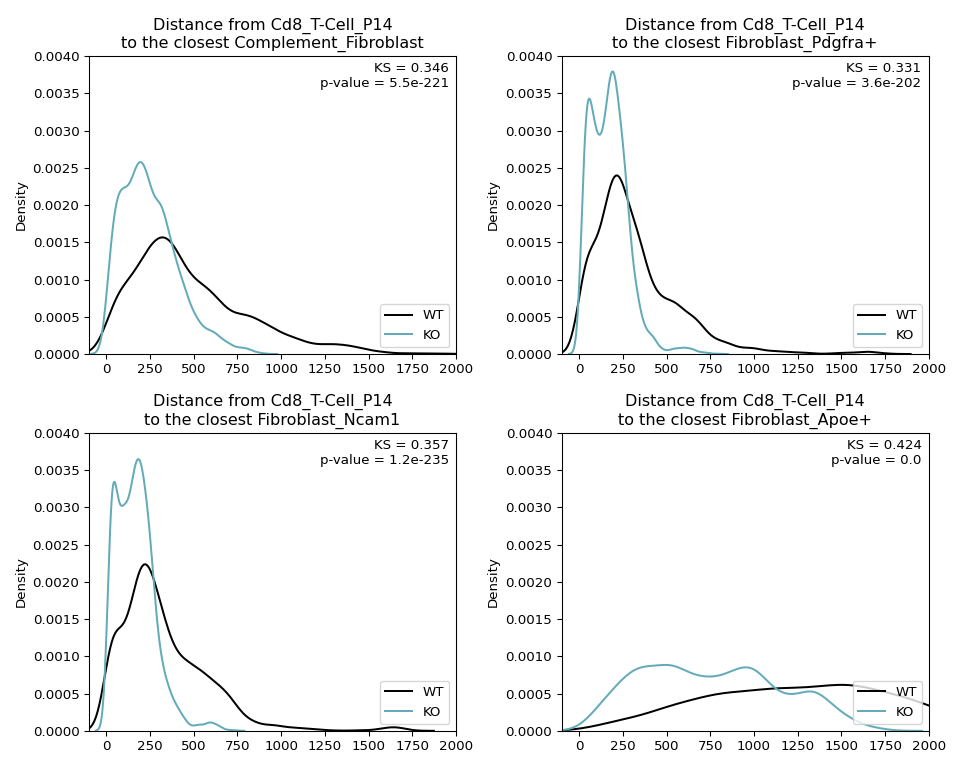
d For every subtype, (left) the correlation coefficients between signature enrichment and P14 cell proximity to the subtype among both WT and TGFβR2 KO P14 CD8 T cells, (middle) the expression of TGFβ isoforms and genes involved in TGFβ presentation in the WT sample, and (right) a non-parametric two-sided Kolmogorov–Smirnov statistic indicating the significance of difference of the distance distributions between P14 CD8 T cells and the corresponding cell type in both WT and TGFβR2 KO. The color of the bars indicates whether P14 CD8 T cells are closer to a given cell type in WT (blue) or TGFβR2 KO (red), and a line indicating effect relevance is positioned at 0.08. Supplemental Table 8 presents the cell counts used in the statistical test for the n = 1 experiment across each condition. e, Comparisons of the distance between WT or TGFβR2 KO P14 cells and selected other cell subtypes. A two-sided Kolmogorov–Smirnov statistic indicates the difference between the WT and KO distributions for each subtype. The plotted lines show the positional density using a 1D kernel density estimate.

图 d 这个复合图展示了 CT8 T 细胞 (P14 亚型)与各细胞亚型的空间互作特征:

  • 左图:展示了在野生型(WT)和 TGFβR2 敲除(KO)P14 CD8 T细胞中,某细胞亚型的特征基因评分(DEG)与 P14 细胞距离的 Spearman 相关系数;黑点(WT) vs 蓝点(KO)的偏移表示TGFβR2 缺失改变空间调控模式
  • 中图:展示了 WT 样本中 TGFβ 通路相关基因的表达情况
  • 右图:P14 CD8 T细胞与各细胞亚型的空间分布差异(KS统计量);橙色条形表示KO 组中 P14 细胞更接近该亚型,蓝色条形表示WT 组中 P14 细胞更接近该亚型,灰色条形表示无显著差异(KS < 0.08)

图 e 进一步对关键亚型距离分布做了直接比较;核密度估计曲线展示 WT(黑)与 KO(蓝)中 P14 细胞到目标亚型的距离分布,顶部显示 KS 值与 p 值。

设置运行环境

1
2
3
4
5
6
7
# 指定 Python 环境
reticulate::use_python("C:/ProgramData/Anaconda3/python.exe")

# 切换工作目录
no = basename(dirname(rstudioapi::getActiveDocumentContext()$path))
wkdir = dirname(rstudioapi::getActiveDocumentContext()$path)
setwd(wkdir)

导入所需库

1
2
3
4
5
6
7
8
9
10
11
12
13
14
15
16
17
18
19
20
import matplotlib
import numpy as np
import pandas as pd
import scanpy as sc
import anndata as ad
import seaborn as sns
import matplotlib.pyplot as plt
import matplotlib.colors as clr
from scipy import stats
from scipy.spatial import distance
import warnings

# 忽略警告信息
warnings.filterwarnings("ignore")

# 添加 ucell 脚本
# pip install git+https://github.com/maximilian-heeg/UCell.git
import sys
sys.path.append(f'{r.wkdir}/data')
import ucell

定义颜色

1
2
3
4
5
6
7
8
9
10
11
12
13
14
15
16
zissou = [
"#3A9AB2",
"#6FB2C1",
"#91BAB6",
"#A5C2A3",
"#BDC881",
"#DCCB4E",
"#E3B710",
"#E79805",
"#EC7A05",
"#EF5703",
"#F11B00",
]

colormap = clr.LinearSegmentedColormap.from_list("Zissou", zissou)
colormap_r = clr.LinearSegmentedColormap.from_list("Zissou", zissou[::-1])

加载数据

1
adata = sc.read_h5ad("data/tgfb.h5ad")

数据处理

1
2
3
4
5
6
7
# 数据标准化处理
sc.pp.normalize_total(adata, target_sum = 1e4) # 标准化每个细胞的总计数为1万
sc.pp.log1p(adata) # 对数转换

# 绘制 Cd8_T-Cell_P14 亚型细胞中表达基因数量的分布
ax = sns.histplot(np.sum(adata.X > 0, axis = 1)[adata.obs["Subtype"] == "Cd8_T-Cell_P14"])
ax.set_xlabel("Number of expressed genes")

特征基因评分

1
2
3
4
5
6
7
8
9
10
11
12
13
14
15
16
# 定义感兴趣的特征基因(DEG:差异表达基因)
signatures = {
"DEG": [
"Itgae+",
"Cxcr6+",
"Cd160+",
"P2rx7+",
"Klf2-",
"Il18rap-",
"S100a4-",
"Mki67-",
]
}

# 使用 UCell 方法计算特征评分
ucell.add_scores(adata, signatures, maxRank = 100, seed = 42)

定义核心函数

从数据中提取表达值

1
2
3
4
5
6
7
8
9
10
11
12
13
14
15
16
17
18
19
20
21
22
23
24
# 从数据中提取表达值
def get_expression(adata: ad.AnnData, key: str) -> np.ndarray:
"""
Retrieves expression values for a given gene or observation annotation from an AnnData object.

Args:
adata: An AnnData object containing expression data.
key: The name of the gene or observation annotation to retrieve.

Returns:
A NumPy array containing the expression values.

Raises:
ValueError: If the key is not found in either the var_names or obs columns of the AnnData object.
"""

# 如果是基因名
if key in adata.var_names:
return np.array(adata[:, key].X.flatten())
# 如果是观测注释
elif key in adata.obs.columns:
return np.array(adata.obs[key])
else:
raise ValueError(f"{key} not found in object")

计算细胞间的空间距离

1
2
3
4
5
6
7
8
9
10
11
12
13
14
15
16
17
18
19
20
21
22
23
24
25
26
27
28
29
# 计算细胞间的空间距离
def get_closest_cell(adata: ad.AnnData, subtype_1: str, subtype_2: str) -> np.ndarray:
"""
Finds the closest cell of a specific subtype to each cell of another subtype.

Args:
adata: An AnnData object containing spatial coordinates and subtype annotations.
subtype_1: The first subtype to consider.
subtype_2: The second subtype to consider.

Returns:
A NumPy array containing the minimum distance to the closest cell in the second subtype for each cell in the first subtype.

Raises:
ValueError: If either subtype is not found in the adata object.
"""

if subtype_1 not in adata.obs["Subtype"].unique():
raise ValueError(f"Subtype {subtype_1} not found in adata")
if subtype_2 not in adata.obs["Subtype"].unique():
raise ValueError(f"Subtype {subtype_2} not found in adata")

# 获取两种亚型细胞的空间坐标
locations_1 = adata[adata.obs["Subtype"] == subtype_1].obsm["X_spatial"]
locations_2 = adata[adata.obs["Subtype"] == subtype_2].obsm["X_spatial"]

# 计算所有细胞对的距离并取最小值
distances_subtype = distance.cdist(locations_1, locations_2).min(axis=1)
return distances_subtype

分析基因表达与细胞距离的相关性

1
2
3
4
5
6
7
8
9
10
11
12
13
14
15
16
17
18
19
20
21
22
23
24
25
26
27
28
29
30
31
32
33
34
35
36
37
38
39
40
41
42
43
44
45
46
47
48
49
50
51
52
53
# 分析基因表达与细胞距离的相关性
def correlation_between_distance_and_expression(
adata: ad.AnnData, subtype: str, key: str, method: str = "spearman"
) -> pd.DataFrame:
"""
Calculates correlation between expression of a given gene/annotation
and distance to cells of other subtypes for a specific subtype.

Args:
adata: An AnnData object containing spatial coordinates, subtype annotations, and expression data.
subtype: The subtype to focus on for expression and distance calculations.
key: The name of the gene or observation annotation to retrieve expression values for.
method: The correlation method to use, either "pearson" or "spearman" (default).

Returns:
A pandas DataFrame with columns 'subtype_1', 'subtype_2', 'pvalue', and 'correlation',
representing the subtype pairs, p-values, and correlation coefficients.
Raises:
ValueError: If either subtype is not found in the adata object or if an invalid method is specified.
"""

if subtype not in adata.obs["Subtype"].unique():
raise ValueError(f"Subtype {subtype} not found in adata")

allowed_methods = ["pearson", "spearman"]
if method not in allowed_methods:
raise ValueError(
f"Invalid correlation method: {method}. Allowed methods are: {', '.join(allowed_methods)}"
)

results = []
for subtype_2 in adata.obs["Subtype"].unique():
# 获取到subtype_2的距离
distances = get_closest_cell(adata, subtype_1=subtype, subtype_2=subtype_2)
# 获取表达值
expression = get_expression(adata[adata.obs["Subtype"] == subtype], key=key)

# 计算相关性
if method == "pearson":
corr, pval = stats.pearsonr(distances, expression)
else:
corr, pval = stats.spearmanr(distances, expression)

results.append(
{
"subtype_1": subtype,
"subtype_2": subtype_2,
"pvalue": pval,
"correlation": corr,
}
)

return pd.DataFrame(results)

分组计算距离与表达的相关性

1
2
3
4
5
6
7
8
9
10
11
12
13
14
15
16
17
18
19
20
21
22
23
24
25
26
27
28
29
30
31
32
33
# 分组计算距离与表达的相关性
def get_batchwise_correlation_between_distance_and_expression(
adata: ad.AnnData, subtype: str, key: str, method: str = "spearman"
) -> pd.DataFrame:
"""
Calculates correlation between distance and expression for a specific subtype across batches,
combining results into a single DataFrame.

Args:
adata: An AnnData object containing spatial coordinates, subtype annotations, expression data, and batch information.
subtype: The subtype to focus on for expression and distance calculations.
key: The name of the gene or observation annotation to retrieve expression values for.

Returns:
A pandas DataFrame containing correlation results for all batches,
with columns 'subtype_1', 'subtype_2', 'pvalue', 'correlation', and 'batch'.
"""

results = []
for b in adata.obs["batch"].cat.categories: # 对每个分组
adata_batch = adata[adata.obs["batch"] == b]
df = correlation_between_distance_and_expression(
adata_batch, subtype=subtype, key=key, method=method
)
df["batch"] = b
results.append(df)

# 合并所有分组结果
df = pd.concat(results, ignore_index=True)
df["batch"] = pd.Categorical(
df["batch"], categories = adata.obs["batch"].cat.categories
)
return df

比较两个组间距离分布的KS检验统计量

1
2
3
4
5
6
7
8
9
10
11
12
13
14
15
16
17
18
19
20
21
22
23
24
25
26
27
28
29
30
31
32
33
34
35
36
37
38
39
40
41
42
43
44
45
46
47
48
49
50
51
52
53
54
55
56
57
58
59
60
61
62
63
# 比较两个组间距离分布的KS检验统计量
def get_ks_statistics(adata: ad.AnnData, subtype: str) -> pd.DataFrame:
"""
Compares the distribution of distances to the closest cell of a given subtype
across two batches in an AnnData object.

Args:
adata: An AnnData object containing the data.
subtype: The subtype of interest.

Returns:
A pandas DataFrame containing the following columns:
- subtype_1: The first subtype being compared.
- subtype_2: The second subtype being compared.
- ks: The Kolmogorov-Smirnov statistic.
- p: The p-value for the Kolmogorov-Smirnov test.
- batch1-batch2: The median difference in distances to the closest cell
between the two batches.

Raises:
ValueError: If the specified subtype is not found in the data or there are not
exactly two batches present.

Examples:
>>> results = get_ks_statistics(adata, "subtype1")
>>> print(results)
"""
from scipy import stats

if subtype not in adata.obs["Subtype"].unique():
raise ValueError(f"Subtype {subtype} not found in adata")

batches = adata.obs["batch"].cat.categories
if len(batches) != 2:
raise ValueError(f"There must be exactly two batches")

print(f"Comparing {batches[0]} and {batches[1]}")

results = []
for subtype_2 in adata.obs["Subtype"].unique():

distances = {}
for b in batches:
adata_batch = adata[adata.obs["batch"] == b]
distances[b] = get_closest_cell(
adata_batch, subtype_1=subtype, subtype_2=subtype_2
)

# KS检验比较两个分布
stat, p = stats.ks_2samp(distances[batches[0]], distances[batches[1]])
diff = np.median(distances[batches[0]]) - np.median(distances[batches[1]])

results.append(
{
"subtype_1": subtype,
"subtype_2": subtype_2,
"ks": stat,
"p": p,
batches[0] + "-" + batches[1]: diff,
}
)

return pd.DataFrame(results)

可视化函数

KS 检验结果的条形图

1
2
3
4
5
6
7
8
9
10
11
12
13
14
15
16
17
18
19
20
21
22
23
24
25
26
27
28
29
30
31
32
# KS 检验结果的条形图
def make_ks_plot(df_ks, order, ax):
# 设置网格线
ax.grid(axis = "y", linestyle = "dashed", dashes = (2, 5), zorder = 1)

# 定义颜色映射
ks_colors = {"closer": "#E07524", "further": "#92CADE", "similar": "#BCBEC0"}
ks_cutoff = 0.075 # KS统计量阈值

ax.axvline(ks_cutoff) # 绘制阈值线

# 绘制每个亚型的 KS 统计量条形图
for subtype in order:
row = df_ks[df_ks["subtype_2"] == subtype].iloc[0].to_dict()

if row["ks"] > ks_cutoff:
if row["WT-KO"] > 0:
color = "closer"
else:
color = "further"
else:
color = "similar"

ax.barh(subtype, row["ks"], 0.8, color = ks_colors[color], zorder = 2)

# 添加图例
handles = [
plt.Line2D([], [], marker = "o", color = ks_colors[c], label = c, ls = "")
for c in ks_colors
]
labels = ks_colors.keys()
ax.legend(handles, labels, loc = "lower right", title = "KS statistics")

基因表达的气泡热图

1
2
3
4
5
6
7
8
9
10
11
12
13
14
15
16
17
18
19
20
21
def make_expression_plot(
adata,
batch,
order,
ax,
genes = ["Tgfb1", "Tgfb2", "Tgfb3", "Itgb6", "Itgb8", "Itgav", "Ltbp1", "Ltbp3"],
):
# 筛选数据和亚型
adata_sub = adata[adata.obs["batch"] == batch]
adata_sub = adata_sub[adata_sub.obs["Subtype"].isin(order)]

# 使用scanpy绘制气泡热图
sc.pl.dotplot(
adata_sub,
var_names = genes,
groupby = "Subtype",
categories_order = order,
ax = ax,
cmap = colormap,
show = False,
)

相关性分析的哑铃图

1
2
3
4
5
6
7
8
9
10
11
12
13
14
15
16
17
18
19
20
21
22
23
24
25
26
27
28
29
30
31
32
33
34
35
def make_dot_plot(df, order, ax):
ax.grid(axis = "y", linestyle = "dashed", dashes = (2, 5), zorder = 1)

# 绘制每个亚型的相关性结果
for subtype in order:
values = df[df["subtype_2"] == subtype]["correlation"].values
# 绘制连接线
ax.plot(
values,
[subtype, subtype],
color="gray",
linestyle="-",
linewidth=1,
zorder=2,
)
# 绘制点(WT和KO)
ax.scatter(values[0], subtype, color = "black", zorder = 3)
ax.scatter(values[1], subtype, color = "#63ABB9", zorder = 3)

# 设置x轴标签
xt = ax.get_xticks()
xt_labels = xt.tolist()
xt_labels = [f"{x:.1f}" for x in xt_labels]
xt_labels[-1] = xt_labels[-1] + "\nStronger signature \nif close to cell"
xt_labels[0] = xt_labels[0] + "\nWeaker signature \nif close to cell"
ax.set_xticks(xt)
ax.set_xticklabels(xt_labels)

# 添加图例
handles = [
plt.Line2D([], [], marker="o", color = "black", label = "WT", ls = ""),
plt.Line2D([], [], marker="o", color = "#63ABB9", label = "KO", ls = ""),
]
labels = ["WT", "KO"]
ax.legend(handles, labels, loc = "lower right", title = "Genotype")

绘图:哑铃图+气泡热图+条形图

计算 CD8+T 细胞 (P14) 的 DEG 评分与到其他细胞距离的相关性

1
2
3
4
5
6
7
8
9
10
11
12
13
14
15
16
17
18
19
20
21
22
23
24
25
26
27
28
29
30
31
df = get_batchwise_correlation_between_distance_and_expression(
adata, "Cd8_T-Cell_P14", "UCell_DEG"
)

# Remove the unknown cell types
df = df[~df["subtype_2"].str.startswith("Unknown")]

# remove the correlation from p14 to P14, these are NaN values
df = df[~(df["subtype_1"] == df["subtype_2"])]

# 反转相关性方向
df["correlation"] = df["correlation"] * -1

# 细胞亚型排序
df = df.sort_values(by=["batch", "correlation"])

df
## subtype_1 subtype_2 pvalue correlation batch
## 23 Cd8_T-Cell_P14 Paneth 2.883865e-64 -0.258803 WT
## 28 Cd8_T-Cell_P14 Resting Fibroblast 5.651265e-56 -0.241557 WT
## 9 Cd8_T-Cell_P14 ISC 6.995561e-52 -0.232514 WT
## 5 Cd8_T-Cell_P14 Transit_Amplifying 2.426639e-48 -0.224367 WT
## 32 Cd8_T-Cell_P14 Neuron 1.281993e-33 -0.186330 WT
## .. ... ... ... ... ...
## 46 Cd8_T-Cell_P14 B-Cell 7.998710e-18 0.132765 KO
## 45 Cd8_T-Cell_P14 Enterocyte_2 3.493086e-21 0.145711 KO
## 55 Cd8_T-Cell_P14 NK-Cell 4.738085e-22 0.148867 KO
## 61 Cd8_T-Cell_P14 MAIT 2.055897e-23 0.153692 KO
## 52 Cd8_T-Cell_P14 Cd8_T-Cell_aa+ 6.332180e-38 0.197661 KO
##
## [72 rows x 5 columns]

计算 KS 统计量

1
2
3
4
5
6
7
8
9
10
11
12
13
14
15
df_ks = get_ks_statistics(adata, "Cd8_T-Cell_P14")
## Comparing WT and KO

# Remove the unknown cell types
df_ks = df_ks[~df_ks["subtype_2"].str.startswith("Unknown")]

# remove the correlation from p14 to P14, these are NaN values
df_ks = df_ks[~(df_ks["subtype_1"] == df_ks["subtype_2"])]
df_ks.head()
## subtype_1 subtype_2 ks p WT-KO
## 0 Cd8_T-Cell_P14 Myofibroblast 0.072754 5.344928e-10 1.636086
## 1 Cd8_T-Cell_P14 Early_Enterocyte 0.094533 1.382596e-16 6.620519
## 2 Cd8_T-Cell_P14 Transit_Amplifying 0.157802 1.564446e-45 25.290413
## 3 Cd8_T-Cell_P14 Enterocyte_3 0.087618 2.622410e-14 -1.732333
## 4 Cd8_T-Cell_P14 Enterocyte_1 0.084082 3.283499e-13 -11.977390

可视化

1
2
3
4
5
6
7
8
9
10
11
12
13
14
15
# 确定亚型显示顺序
order = df["subtype_2"].unique()

# 创建复合图形
fig, (ax1, ax2, ax3) = plt.subplots(
nrows = 1, ncols = 3, figsize = (18, 8), width_ratios = [5, 3, 1]
)

# 绘制三个子图
make_dot_plot(df, order, ax1) # 相关性点哑铃图
make_expression_plot(adata, "WT", order[::-1], ax2) # 基因表达气泡图
make_ks_plot(df_ks, order, ax3) # KS统计量条形图

fig.savefig(f'{r.no}.png', dpi = 300, bbox_inches = 'tight')
fig.tight_layout()

绘图:距离分布核密度图

可视化 CD8 T细胞 (P14) 与不同成纤维细胞亚型间的距离分布差异

核心函数

1
2
3
4
5
6
7
8
9
10
11
12
13
14
15
16
17
18
19
20
21
22
23
24
25
26
27
28
29
30
31
32
33
34
35
36
37
38
39
40
41
42
43
44
45
46
47
48
49
50
51
52
53
54
55
56
57
58
59
60
61
62
63
64
65
def plot_histogram(
adata: ad.AnnData,
subtype_1: str,
subtype_2: str,
ax: matplotlib.axes.Axes,
ymax: float = 0.004,
xmax: float = 2000.0,
) -> None:
"""
Plots a histogram of distances for two subtypes across two batches.

Args:
adata: AnnData object containing expression data and metadata.
subtype_1: Name of the first subtype to compare.
subtype_2: Name of the second subtype to compare.
ax: Matplotlib axes object to plot the histogram on.
ymax: Maximum y-axis value for the plot (default: 0.004).
xmax: Maximum x-axis value for the plot (default: 2000).

Raises:
ValueError: If either subtype is not found in adata or if there are not exactly two batches.

Returns:
None
"""
from scipy import stats

if subtype_1 not in adata.obs["Subtype"].unique():
raise ValueError(f"Subtype {subtype_1} not found in adata")
if subtype_2 not in adata.obs["Subtype"].unique():
raise ValueError(f"Subtype {subtype_2} not found in adata")

batches = adata.obs["batch"].cat.categories
if len(batches) != 2:
raise ValueError(f"There must be exactly two batches")

# 计算距离
distances = {}
for b in batches:
adata_batch = adata[adata.obs["batch"] == b]
distances[b] = get_closest_cell(
adata_batch, subtype_1 = subtype_1, subtype_2 = subtype_2
)

# KS检验
stat, p = stats.ks_2samp(distances[batches[0]], distances[batches[1]])
diff = np.median(distances[batches[0]]) - np.median(distances[batches[1]])

# 绘制核密度估计图
sns.kdeplot(distances[batches[0]], ax = ax, label = batches[0], color = "black")
sns.kdeplot(distances[batches[1]], ax = ax, label = batches[1], color = "#63ABB9")

# 添加统计信息
ax.text(
0.98,
0.98,
f"KS = {stat:.3f}\np-value = {p:3.2}",
horizontalalignment = "right",
verticalalignment = "top",
transform = ax.transAxes,
)
ax.legend(loc = "lower right")
ax.set_ylim(0, ymax)
ax.set_xlim(-100, xmax)
ax.set_title(f"Distance from {subtype_1}\nto the closest {subtype_2}")

可视化

1
2
3
4
5
6
7
8
9
10
11
12
13
14
# 绘制多个成纤维细胞亚型的距离分布
fig, axes = plt.subplots(2, 2, figsize = (10, 8))

subtypes = [
"Complement_Fibroblast",
"Fibroblast_Pdgfra+",
"Fibroblast_Ncam1",
"Fibroblast_Apoe+",
]

for subtype, ax in zip(subtypes, axes.flatten()):
plot_histogram(adata, "Cd8_T-Cell_P14", subtype, ax)

fig.tight_layout()

版本信息

1
2
3
4
5
6
7
8
9
10
11
12
13
14
15
16
17
18
19
20
21
22
23
24
25
26
27
28
29
30
31
32
33
34
35
36
37
38
39
40
41
42
43
44
45
46
47
48
49
50
51
52
53
54
55
56
57
58
59
60
61
62
63
64
65
66
67
68
69
70
71
72
73
74
75
76
77
78
79
80
81
82
83
84
85
86
87
88
89
90
91
92
93
94
95
96
97
98
99
100
101
102
103
104
105
106
107
108
109
110
111
112
113
114
115
116
117
118
119
120
121
122
123
124
125
126
127
128
129
130
131
132
133
134
135
136
137
138
139
140
141
142
143
144
145
146
147
148
149
150
151
152
153
154
155
156
157
158
159
160
161
162
163
164
165
166
167
168
169
170
171
172
173
174
175
176
177
178
179
180
181
182
183
184
185
186
187
188
189
190
191
192
193
194
195
196
197
198
199
200
201
202
203
204
205
206
207
208
209
210
211
212
213
214
215
216
217
218
219
220
221
222
223
224
225
226
227
228
229
230
231
232
233
234
235
236
237
238
239
240
241
242
243
244
245
246
247
248
249
250
251
252
253
254
255
256
257
258
259
260
261
262
263
264
265
266
267
268
269
270
271
272
273
274
275
276
277
278
279
280
281
282
283
284
285
286
287
288
289
290
291
292
293
294
295
296
297
298
299
300
301
302
303
304
305
306
307
308
309
310
311
312
313
314
315
316
317
318
319
320
321
322
323
324
325
326
327
328
329
330
331
332
333
334
335
336
337
338
339
340
341
342
343
344
345
346
347
348
349
350
351
352
353
354
355
356
357
358
359
360
361
362
363
364
365
366
367
368
369
370
371
372
373
374
375
376
377
378
379
380
381
382
383
384
385
386
387
388
389
390
391
392
393
394
395
396
397
398
399
400
401
402
403
404
405
406
407
408
409
410
411
412
413
414
415
416
417
418
419
420
421
422
423
424
425
426
427
428
429
430
431
432
433
434
435
436
437
438
439
import sys
import platform
import pkg_resources

def session_info():
print("Python Session Information")
print("==========================")

# Python 版本信息
print(f"Python Version: {sys.version}")
print(f"Python Implementation: {platform.python_implementation()}")
print(f"Python Build: {platform.python_build()}")

# 操作系统信息
print("\nOperating System Information")
print(f"OS: {platform.system()}")
print(f"OS Release: {platform.release()}")
print(f"OS Version: {platform.version()}")
print(f"Machine: {platform.machine()}")
print(f"Processor: {platform.processor()}")

# 已安装的包及其版本
print("\nInstalled Packages")
print("------------------")
installed_packages = sorted(
[(dist.key, dist.version) for dist in pkg_resources.working_set],
key=lambda x: x[0].lower()
)
for package, version in installed_packages:
print(f"{package}: {version}")

# 调用函数
session_info()
## Python Session Information
## ==========================
## Python Version: 3.9.12 (main, Apr 4 2022, 05:22:27) [MSC v.1916 64 bit (AMD64)]
## Python Implementation: CPython
## Python Build: ('main', 'Apr 4 2022 05:22:27')
##
## Operating System Information
## OS: Windows
## OS Release: 10
## OS Version: 10.0.26100
## Machine: AMD64
## Processor: Intel64 Family 6 Model 151 Stepping 2, GenuineIntel
##
## Installed Packages
## ------------------
## absl-py: 2.2.2
## aiohttp: 3.8.1
## aiosignal: 1.2.0
## alabaster: 0.7.12
## anaconda-client: 1.9.0
## anaconda-navigator: 2.1.4
## anaconda-project: 0.10.2
## anndata: 0.10.9
## anyio: 3.5.0
## appdirs: 1.4.4
## argon2-cffi: 21.3.0
## argon2-cffi-bindings: 21.2.0
## array-api-compat: 1.11.2
## arrow: 1.2.2
## astroid: 2.6.6
## astropy: 5.0.4
## asttokens: 2.0.5
## astunparse: 1.6.3
## async-timeout: 4.0.1
## atomicwrites: 1.4.0
## attrs: 21.4.0
## automat: 20.2.0
## autopep8: 1.6.0
## babel: 2.9.1
## backcall: 0.2.0
## backports.functools-lru-cache: 1.6.4
## backports.tempfile: 1.0
## backports.weakref: 1.0.post1
## bcrypt: 3.2.0
## beautifulsoup4: 4.11.1
## binaryornot: 0.4.4
## biopython: 1.79
## bitarray: 2.4.1
## bkcharts: 0.2
## black: 19.10b0
## bleach: 4.1.0
## bokeh: 2.4.2
## boto3: 1.21.32
## botocore: 1.24.32
## bottleneck: 1.3.4
## brotlipy: 0.7.0
## cachetools: 4.2.2
## causal-learn: 0.1.4.1
## certifi: 2021.10.8
## cffi: 1.15.0
## chardet: 4.0.0
## charset-normalizer: 2.0.4
## clarabel: 0.10.0
## click: 8.0.4
## cloudpickle: 2.0.0
## clyent: 1.2.2
## colorama: 0.4.4
## colorcet: 2.0.6
## comtypes: 1.1.10
## conda: 4.12.0
## conda-build: 3.21.8
## conda-content-trust: 0+unknown
## conda-pack: 0.6.0
## conda-package-handling: 1.8.1
## conda-repo-cli: 1.0.4
## conda-token: 0.3.0
## conda-verify: 3.4.2
## constantly: 15.1.0
## contourpy: 1.3.0
## cookiecutter: 1.7.3
## cryptography: 3.4.8
## cssselect: 1.1.0
## cvxpy: 1.6.5
## cycler: 0.11.0
## cython: 0.29.28
## cytoolz: 0.11.0
## daal4py: 2021.5.0
## dask: 2022.2.1
## datashader: 0.13.0
## datashape: 0.5.4
## debugpy: 1.5.1
## decorator: 5.1.1
## defusedxml: 0.7.1
## diff-match-patch: 20200713
## distributed: 2022.2.1
## docutils: 0.17.1
## docxcompose: 1.4.0
## docxtpl: 0.19.1
## dowhy: 0.12
## entrypoints: 0.4
## et-xmlfile: 1.1.0
## exceptiongroup: 1.3.0
## executing: 0.8.3
## fastjsonschema: 2.15.1
## filelock: 3.6.0
## flake8: 3.9.2
## flask: 1.1.2
## flatbuffers: 25.2.10
## fonttools: 4.25.0
## frozenlist: 1.2.0
## fsspec: 2022.2.0
## future: 0.18.2
## gast: 0.6.0
## gensim: 4.1.2
## get-annotations: 0.1.2
## glob2: 0.7
## google-api-core: 1.25.1
## google-auth: 1.33.0
## google-cloud-core: 1.7.1
## google-cloud-storage: 1.31.0
## google-crc32c: 1.1.2
## google-pasta: 0.2.0
## google-resumable-media: 1.3.1
## googleapis-common-protos: 1.53.0
## graphviz: 0.20.3
## greenlet: 1.1.1
## grpcio: 1.71.0
## h5py: 3.13.0
## heapdict: 1.0.1
## holoviews: 1.14.8
## hvplot: 0.7.3
## hyperlink: 21.0.0
## idna: 3.3
## imagecodecs: 2021.8.26
## imageio: 2.9.0
## imagesize: 1.3.0
## importlib-metadata: 4.11.3
## importlib-resources: 6.5.2
## incremental: 21.3.0
## inflection: 0.5.1
## iniconfig: 1.1.1
## intake: 0.6.5
## intervaltree: 3.1.0
## ipykernel: 6.9.1
## ipython: 8.2.0
## ipython-genutils: 0.2.0
## ipywidgets: 7.6.5
## isort: 5.9.3
## itemadapter: 0.3.0
## itemloaders: 1.0.4
## itsdangerous: 2.0.1
## jdcal: 1.4.1
## jedi: 0.18.1
## jinja2: 2.11.3
## jinja2-time: 0.2.0
## jmespath: 0.10.0
## joblib: 1.4.2
## json5: 0.9.6
## jsonschema: 4.4.0
## jupyter: 1.0.0
## jupyter-client: 6.1.12
## jupyter-console: 6.4.0
## jupyter-core: 4.9.2
## jupyter-server: 1.13.5
## jupyterlab: 3.3.2
## jupyterlab-pygments: 0.1.2
## jupyterlab-server: 2.10.3
## jupyterlab-widgets: 1.0.0
## keras: 3.9.2
## keyring: 23.4.0
## kiwisolver: 1.3.2
## lazy-object-proxy: 1.6.0
## legacy-api-wrap: 1.4.1
## libarchive-c: 2.9
## libclang: 18.1.1
## lightgbm: 4.6.0
## llvmlite: 0.43.0
## locket: 0.2.1
## looseversion: 1.3.0
## lxml: 4.8.0
## markdown: 3.3.4
## markdown-it-py: 3.0.0
## markupsafe: 2.0.1
## matplotlib: 3.9.4
## matplotlib-inline: 0.1.2
## mccabe: 0.6.1
## mdurl: 0.1.2
## menuinst: 1.4.18
## mistune: 0.8.4
## mkl-fft: 1.3.1
## mkl-random: 1.2.2
## mkl-service: 2.4.0
## ml-dtypes: 0.5.1
## mock: 4.0.3
## momentchi2: 0.1.8
## mpmath: 1.2.1
## msgpack: 1.0.2
## multidict: 5.1.0
## multipledispatch: 0.6.0
## munkres: 1.1.4
## mypy-extensions: 0.4.3
## namex: 0.0.9
## natsort: 8.4.0
## navigator-updater: 0.2.1
## nbclassic: 0.3.5
## nbclient: 0.5.13
## nbconvert: 6.4.4
## nbformat: 5.3.0
## nest-asyncio: 1.5.5
## networkx: 3.2.1
## nltk: 3.7
## nose: 1.3.7
## notebook: 6.4.8
## numba: 0.60.0
## numexpr: 2.8.1
## numpy: 1.26.4
## numpydoc: 1.2
## olefile: 0.46
## opencv-python: 4.11.0.86
## openpyxl: 3.0.9
## opt-einsum: 3.4.0
## optree: 0.15.0
## osqp: 1.0.3
## packaging: 21.3
## pandas: 1.5.3
## pandocfilters: 1.5.0
## panel: 0.13.0
## param: 1.12.0
## paramiko: 2.8.1
## parsel: 1.6.0
## parso: 0.8.3
## partd: 1.2.0
## pathspec: 0.7.0
## patsy: 1.0.1
## pep8: 1.7.1
## pexpect: 4.8.0
## pickleshare: 0.7.5
## pillow: 9.0.1
## pims: 0.7
## pip: 21.2.4
## pkginfo: 1.8.2
## plotly: 5.6.0
## pluggy: 1.0.0
## poyo: 0.5.0
## prometheus-client: 0.13.1
## prompt-toolkit: 3.0.20
## protego: 0.1.16
## protobuf: 5.29.4
## psutil: 5.8.0
## ptyprocess: 0.7.0
## pure-eval: 0.2.2
## py: 1.11.0
## pyasn1: 0.4.8
## pyasn1-modules: 0.2.8
## pycodestyle: 2.7.0
## pycosat: 0.6.3
## pycparser: 2.21
## pyct: 0.4.6
## pycurl: 7.44.1
## pydispatcher: 2.0.5
## pydocstyle: 6.1.1
## pydot: 3.0.4
## pyerfa: 2.0.0
## pyflakes: 2.3.1
## pygments: 2.19.1
## pyhamcrest: 2.0.2
## pyjwt: 2.1.0
## pylint: 2.9.6
## pyls-spyder: 0.4.0
## pymysql: 1.1.1
## pynacl: 1.4.0
## pynndescent: 0.5.13
## pyodbc: 4.0.32
## pyopenssl: 21.0.0
## pyparsing: 3.2.3
## pypdf2: 3.0.1
## pyreadline: 2.1
## pyrsistent: 0.18.0
## pysocks: 1.7.1
## pytest: 7.1.1
## python-dateutil: 2.8.2
## python-docx: 1.1.2
## python-lsp-black: 1.0.0
## python-lsp-jsonrpc: 1.0.0
## python-lsp-server: 1.2.4
## python-slugify: 5.0.2
## python-snappy: 0.6.0
## pytz: 2021.3
## pyviz-comms: 2.0.2
## pywavelets: 1.3.0
## pywin32: 302
## pywin32-ctypes: 0.2.0
## pywinpty: 2.0.2
## pyyaml: 6.0
## pyzmq: 22.3.0
## qdarkstyle: 3.0.2
## qstylizer: 0.1.10
## qtawesome: 1.0.3
## qtconsole: 5.3.0
## qtpy: 2.0.1
## queuelib: 1.5.0
## regex: 2022.3.15
## requests: 2.27.1
## requests-file: 1.5.1
## rich: 14.0.0
## rope: 0.22.0
## rsa: 4.7.2
## rtree: 0.9.7
## ruamel-yaml-conda: 0.15.100
## s3transfer: 0.5.0
## scanpy: 1.10.3
## scikit-image: 0.19.2
## scikit-learn: 1.6.1
## scikit-learn-intelex: 2021.20220215.102710
## scipy: 1.13.1
## scrapy: 2.6.1
## scs: 3.2.7.post2
## seaborn: 0.13.2
## send2trash: 1.8.0
## service-identity: 18.1.0
## session-info: 1.0.1
## setuptools: 61.2.0
## shap: 0.47.2
## sip: 4.19.13
## six: 1.16.0
## slicer: 0.0.8
## slicerator: 1.1.0
## smart-open: 5.1.0
## sniffio: 1.2.0
## snowballstemmer: 2.2.0
## sortedcollections: 2.1.0
## sortedcontainers: 2.4.0
## soupsieve: 2.3.1
## sphinx: 4.4.0
## sphinxcontrib-applehelp: 1.0.2
## sphinxcontrib-devhelp: 1.0.2
## sphinxcontrib-htmlhelp: 2.0.0
## sphinxcontrib-jsmath: 1.0.1
## sphinxcontrib-qthelp: 1.0.3
## sphinxcontrib-serializinghtml: 1.1.5
## spyder: 5.1.5
## spyder-kernels: 2.1.3
## sqlalchemy: 1.4.32
## stack-data: 0.2.0
## statsmodels: 0.14.4
## stdlib-list: 0.11.1
## sympy: 1.13.3
## tables: 3.6.1
## tabulate: 0.8.9
## tbb: 0.2
## tblib: 1.7.0
## tenacity: 8.0.1
## tensorboard: 2.19.0
## tensorboard-data-server: 0.7.2
## tensorflow: 2.19.0
## tensorflow-io-gcs-filesystem: 0.31.0
## termcolor: 3.1.0
## terminado: 0.13.1
## testpath: 0.5.0
## text-unidecode: 1.3
## textdistance: 4.2.1
## threadpoolctl: 3.6.0
## three-merge: 0.1.1
## tifffile: 2021.7.2
## tinycss: 0.4
## tldextract: 3.2.0
## toml: 0.10.2
## tomli: 1.2.2
## toolz: 0.11.2
## torch: 2.7.0+cu128
## torchaudio: 2.7.0+cu128
## torchvision: 0.22.0+cu128
## tornado: 6.1
## tqdm: 4.64.0
## trackpy: 0.5.0
## traitlets: 5.1.1
## twisted: 22.2.0
## twisted-iocpsupport: 1.0.2
## typed-ast: 1.4.3
## typing-extensions: 4.13.1
## ujson: 5.1.0
## umap-learn: 0.5.7
## unidecode: 1.2.0
## urllib3: 1.26.9
## w3lib: 1.21.0
## watchdog: 2.1.6
## wcwidth: 0.2.5
## webencodings: 0.5.1
## websocket-client: 0.58.0
## werkzeug: 2.0.3
## wheel: 0.37.1
## widgetsnbextension: 3.5.2
## win-inet-pton: 1.1.0
## win-unicode-console: 0.5
## wincertstore: 0.2
## wrapt: 1.12.1
## xarray: 0.20.1
## xgboost: 2.1.4
## xlrd: 2.0.1
## xlsxwriter: 3.0.3
## xlwings: 0.24.9
## yapf: 0.31.0
## yarl: 1.6.3
## zict: 2.0.0
## zipp: 3.7.0
## zope.interface: 5.4.0
  • Title: 跟着顶刊学分析之单细胞组学结合统计方法解析分布差异
  • Author: Xing Abao
  • Created at : 2025-05-12 16:42:18
  • Updated at : 2025-05-19 12:51:04
  • Link: https://bioinformatics.vip/2025/05/12/SCI/250512_sci_spatial_scrna/
  • License: This work is licensed under CC BY-NC-SA 4.0.
Comments