在应用曼特尔检验时,首先假设两个矩阵之间不存在相关关系,并计算它们之间的原始相关系数;接着,通过置换检验随机改变其中一个矩阵的行和列顺序,并重新计算置换后的相关系数。这个过程重复多次,以生成一个相关系数的分布。最后,将原始观测到的相关系数与这个分布进行比较,以确定其是否具有统计学意义。如果观测到的相关性的
P 值小于预设的显著性水平,则可以拒绝原假设,认为两个矩阵之间存在相关性。
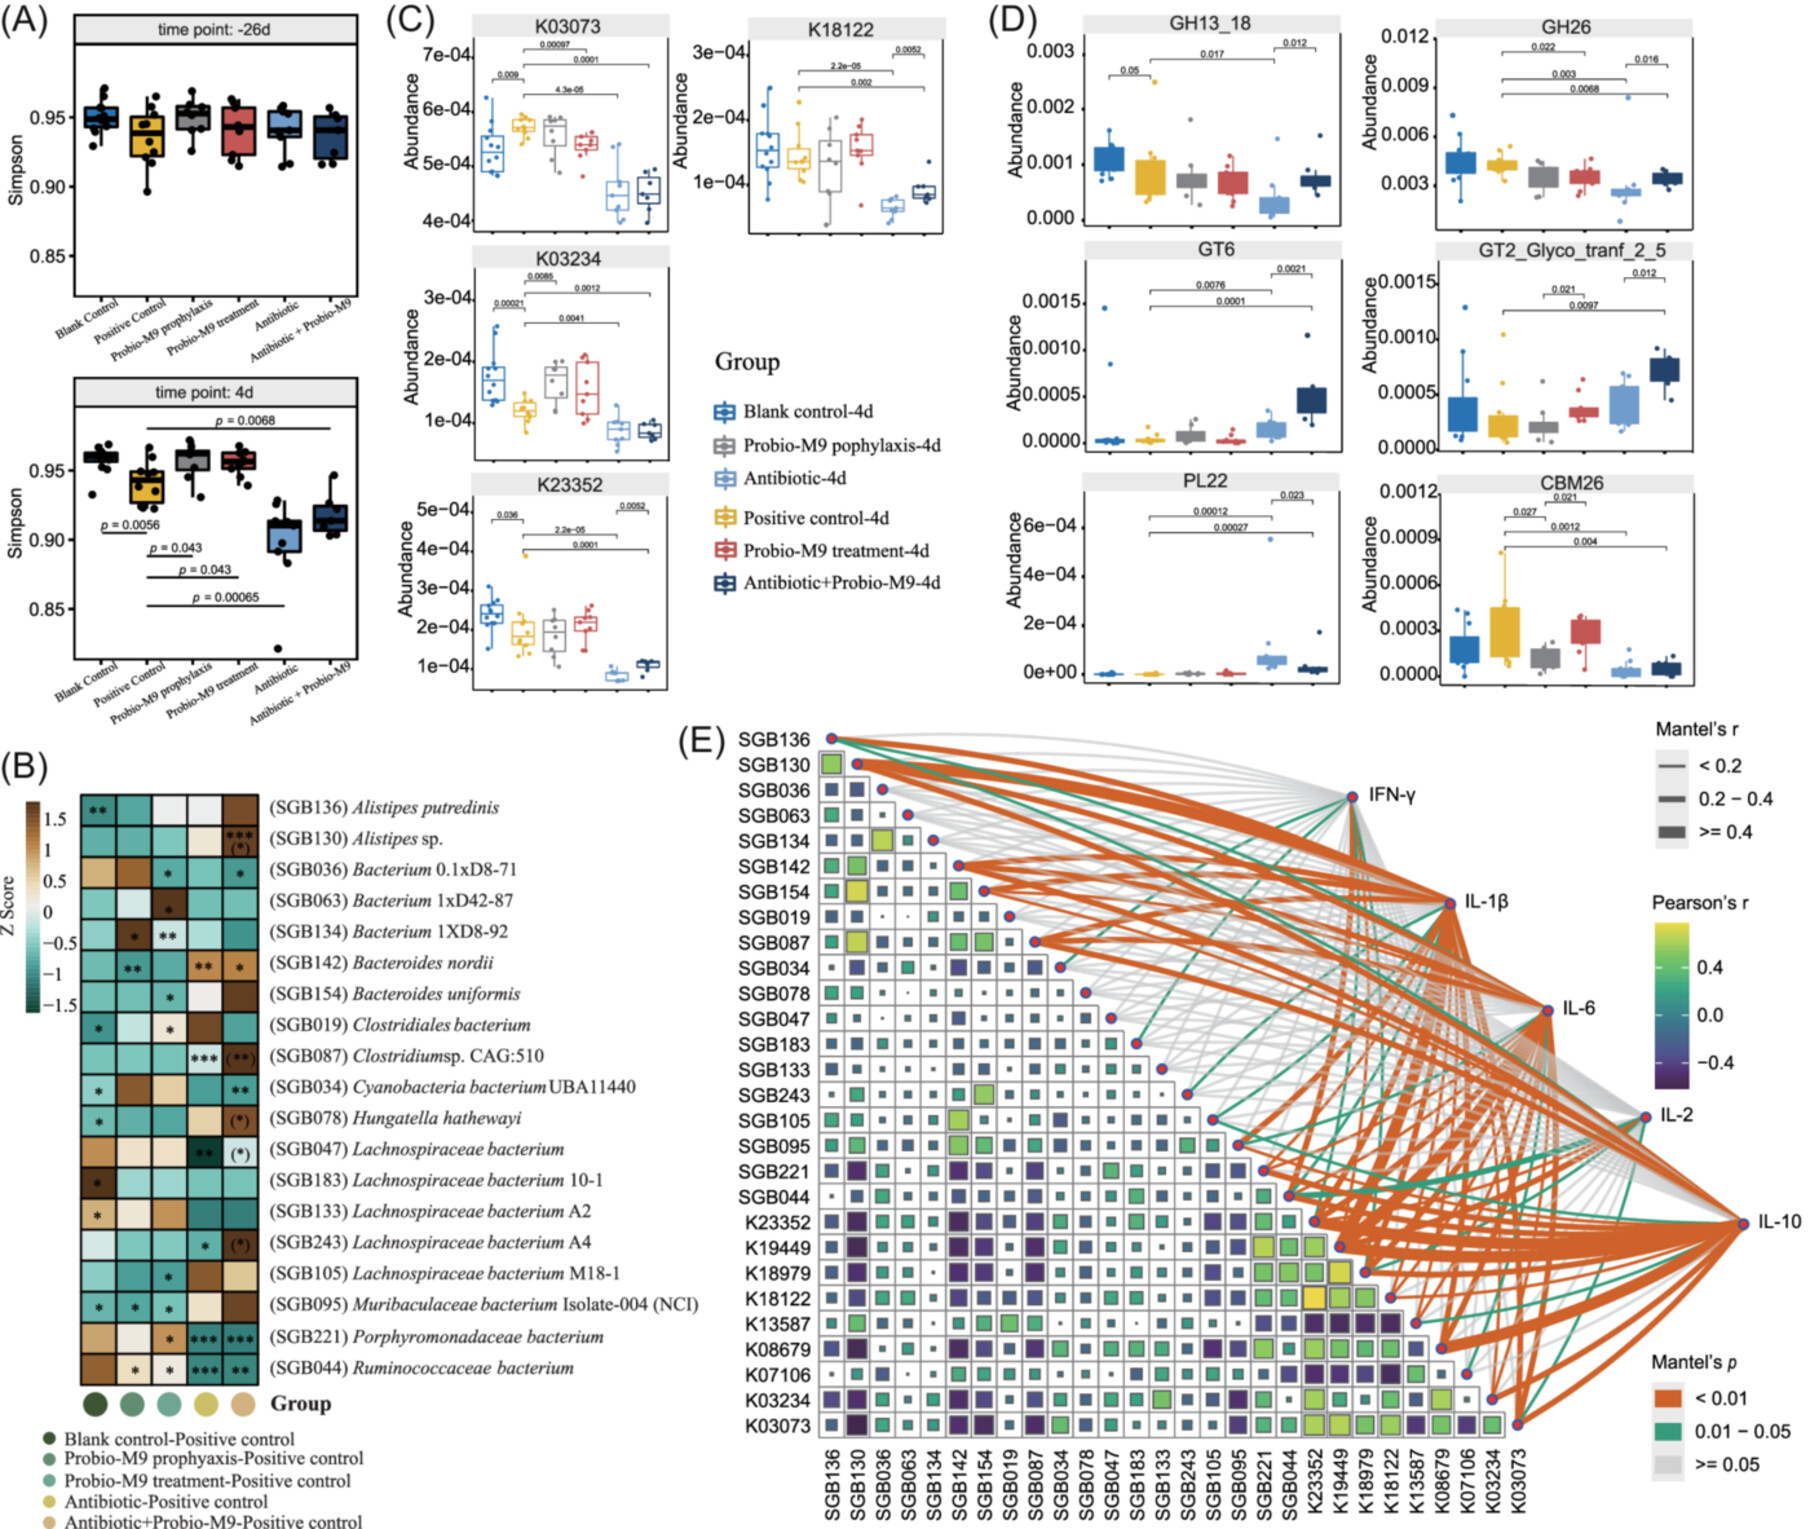
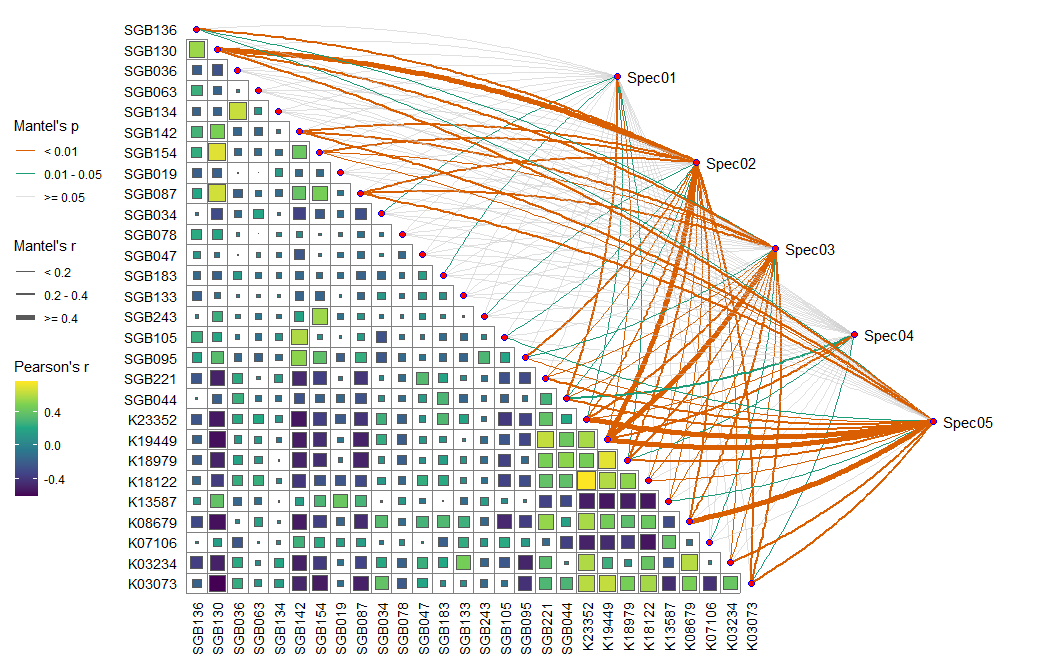
Fig.2(E) The heatmap illustrates Pearson’s correlation between
significant differential abundant KOs and SGBs, while the network shows
the correlations between cytokine levels, including interferon (IFN)-γ,
interleukin (IL)-10, IL-1β, IL-2, and IL-6, and these KOs and SGBs,
evaluated by the partial Mantel test. Mantel’s p and r values are
indicated by different line colors and thickness, respectively, while
Pearson’s correlation is represented by the color scale.
qcorrplot(correlate(varechem), type ="lower", diag =FALSE)+ geom_square()+ geom_couple( aes(colour = pd, size = rd), data = mantel, curvature = nice_curvature() )+ scale_size_manual(values =c(0.5,1,2))+ scale_colour_manual(values = color_pal(3))+ guides( size = guide_legend(title ="Mantel's r", override.aes =list(colour ="grey35"), order =2), colour = guide_legend(title ="Mantel's p", override.aes =list(size =3), order =1), fill = guide_colorbar(title ="Pearson's r", order =3) )
10.1002/imt2.224 Fig.2E
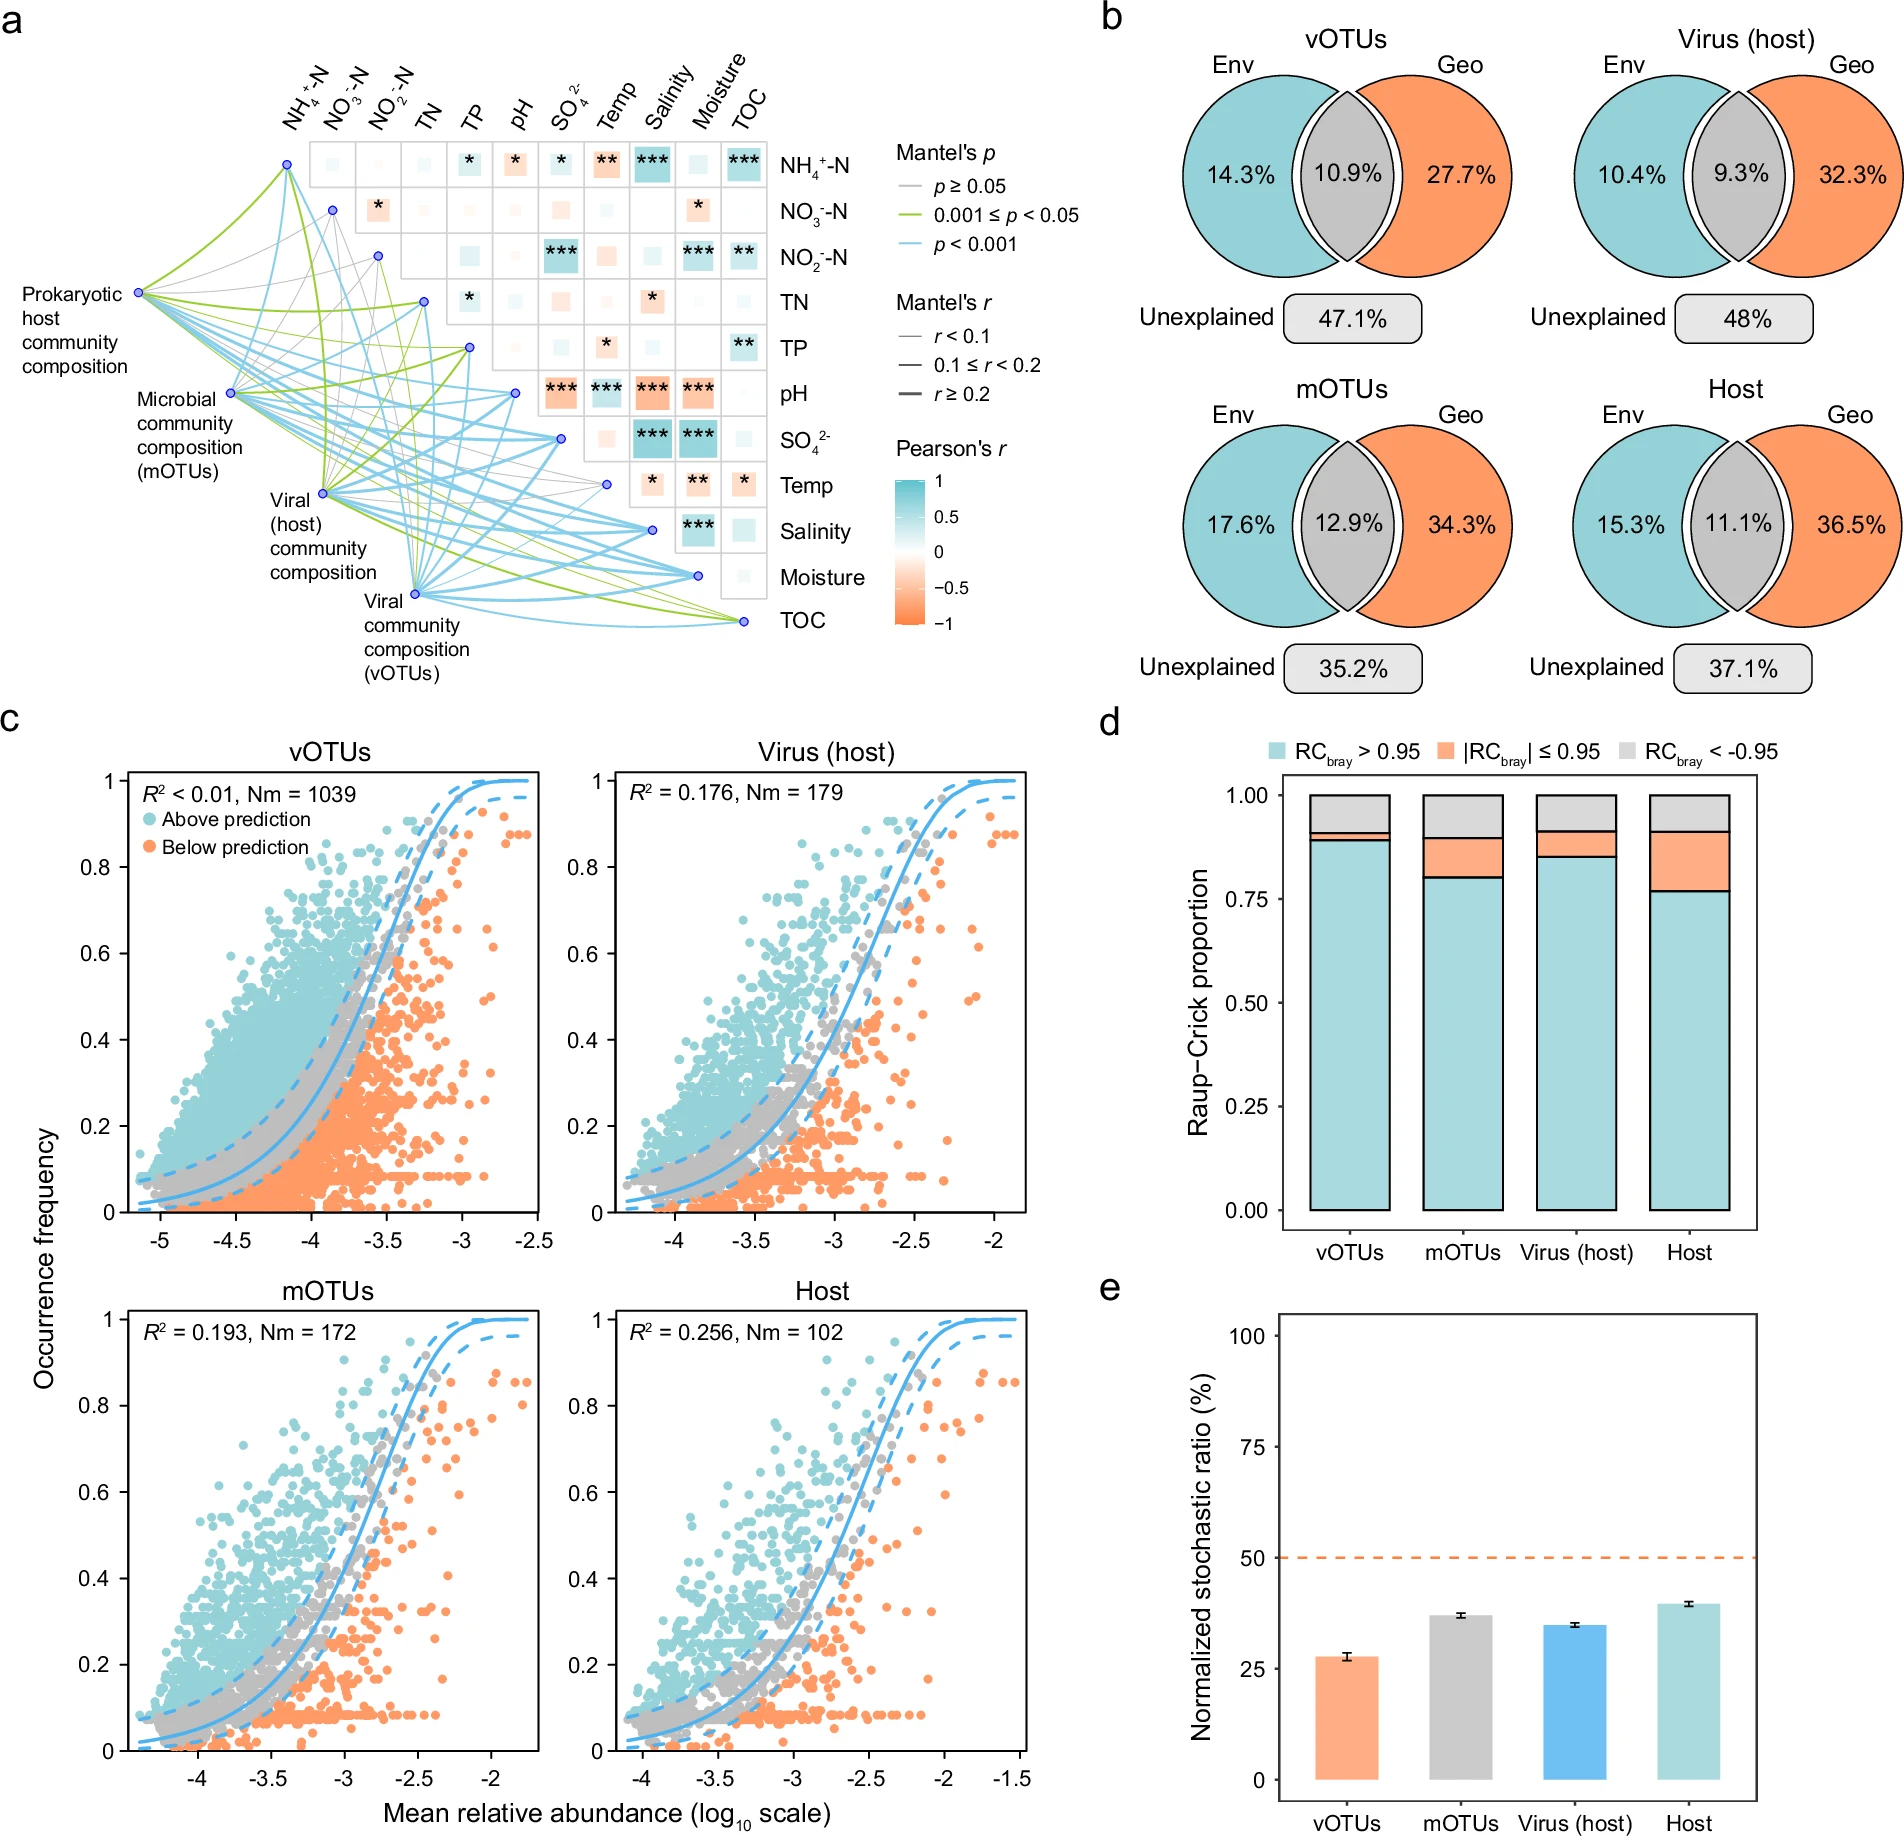
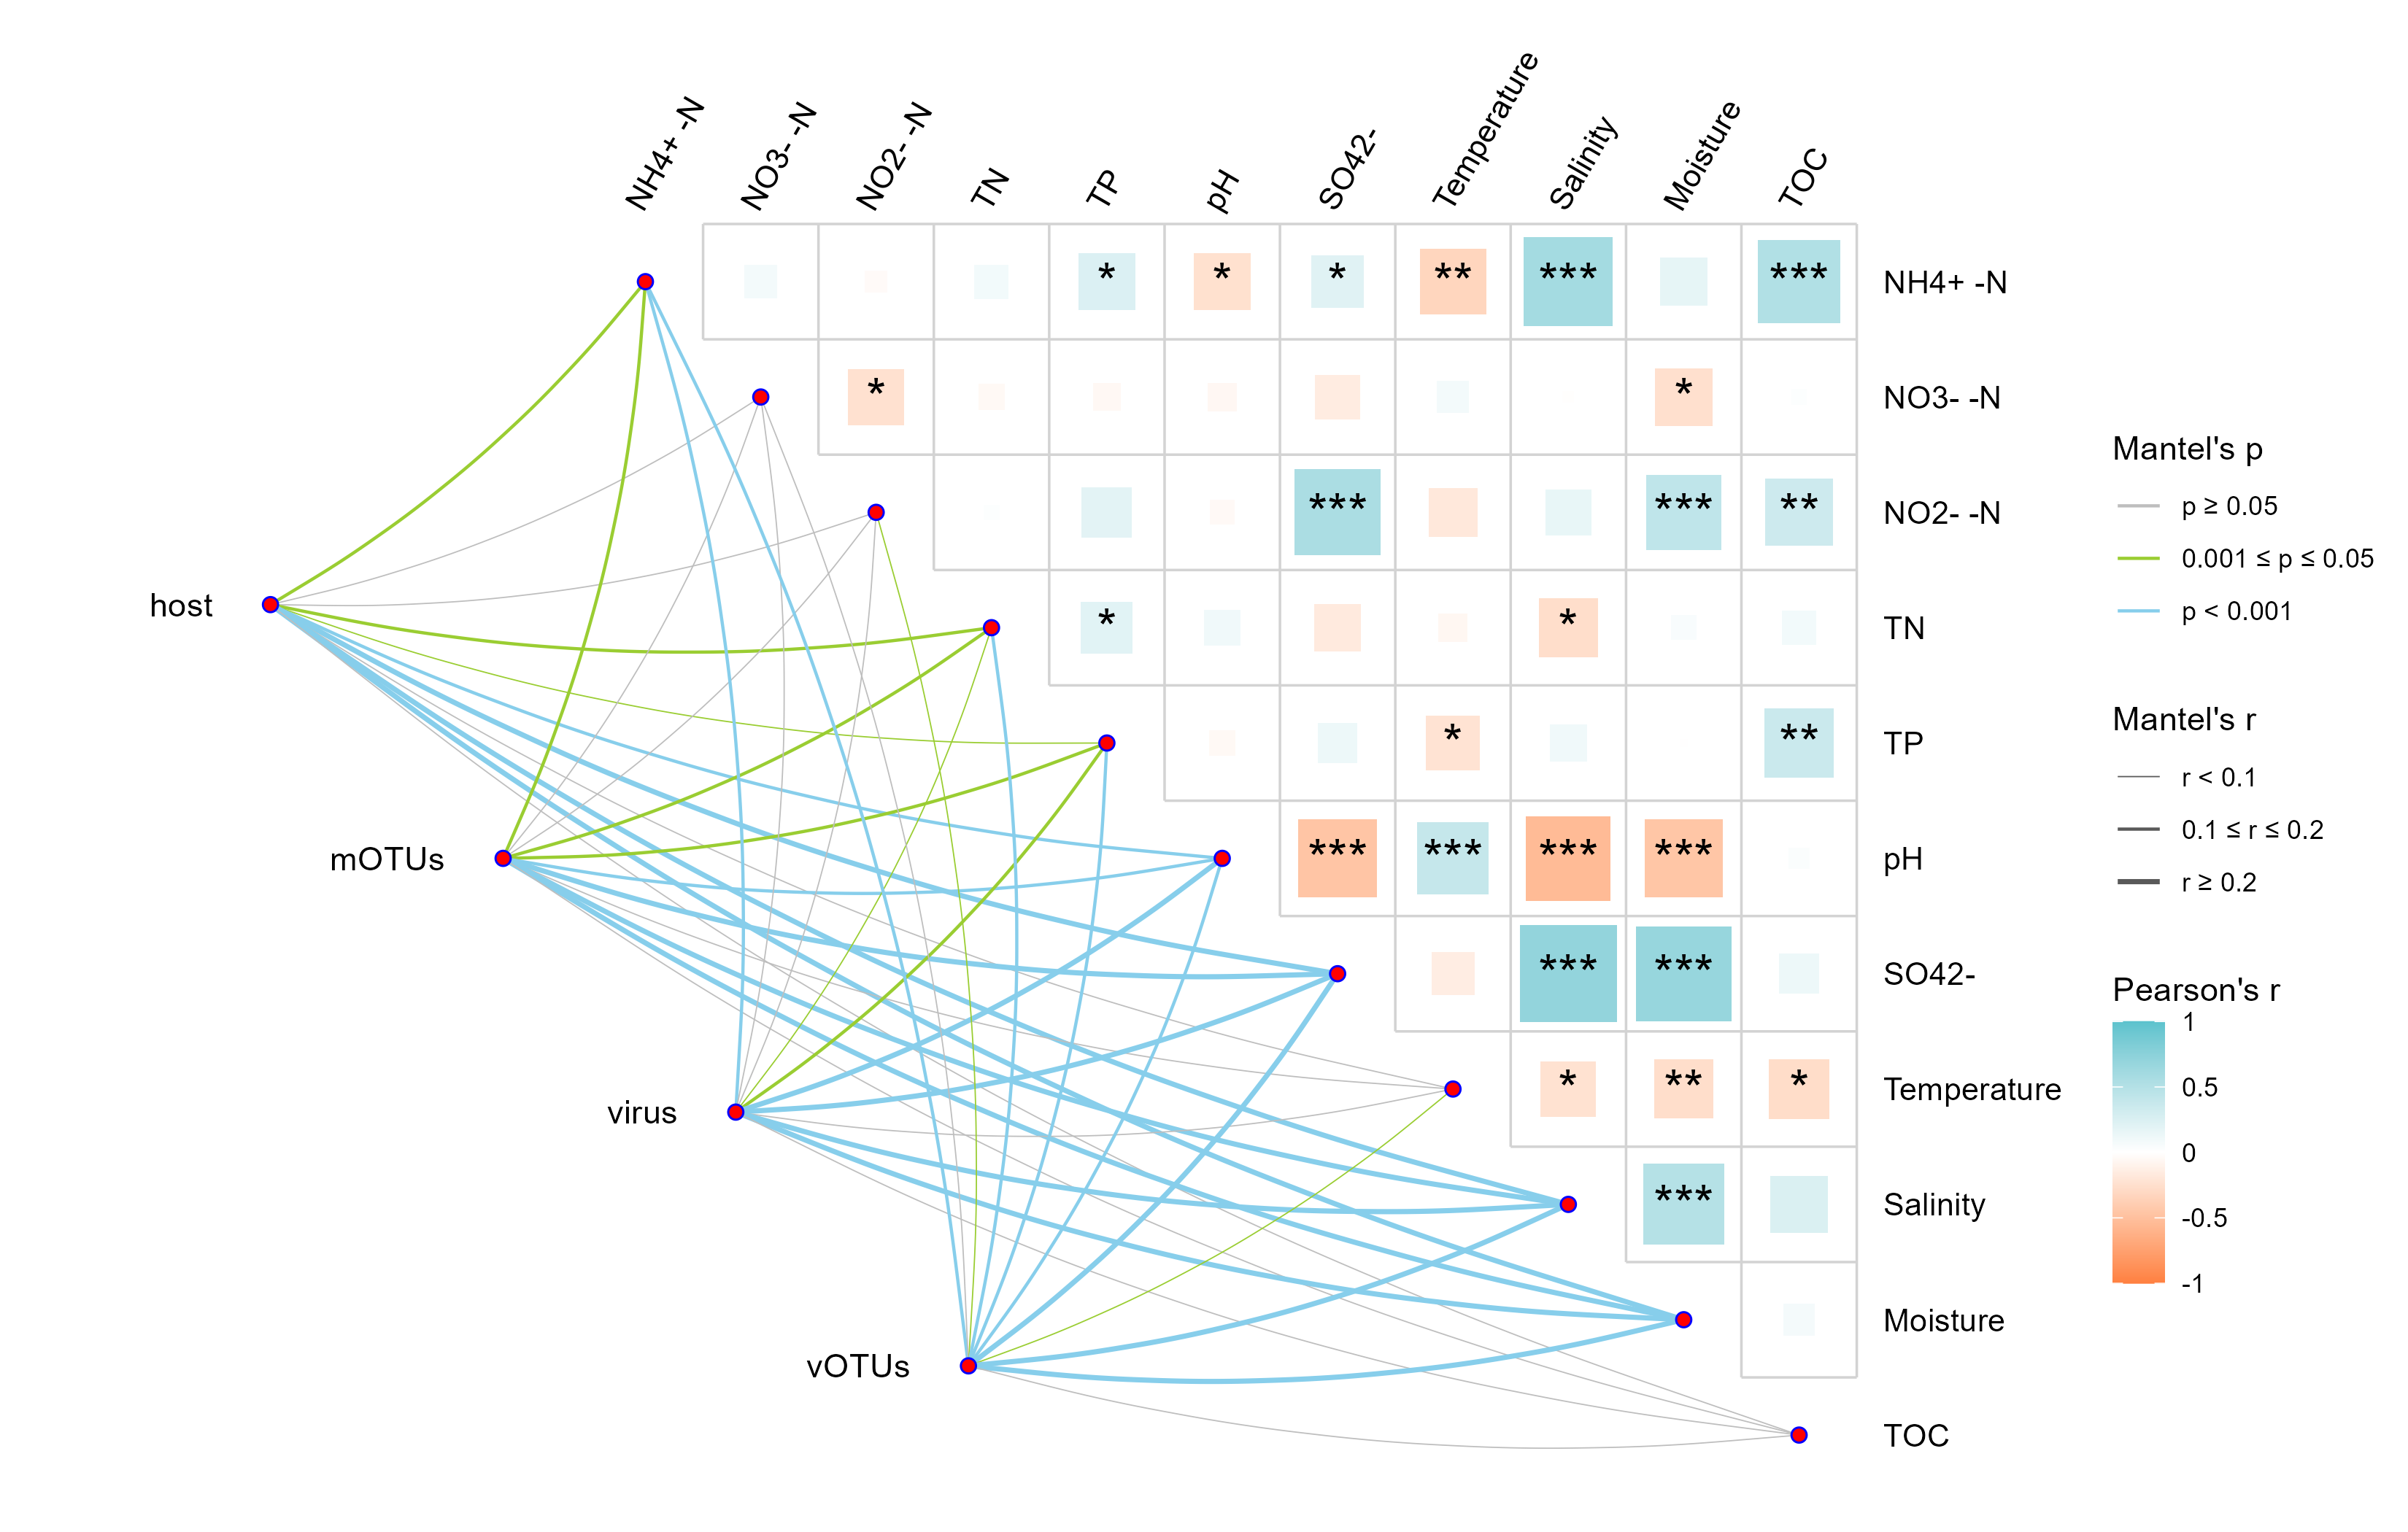
Fig.5 Analyses were performed for vOTUs, mOTUs, vOTUs assigned with
hosts, and microbial hosts. a Partial mantel tests showing the
relationship between environmental factors and viral/microbial
communities. The edge color and width represent the Mantel’s r and p
value, respectively. The color gradient in heatmap represents the
Pearson’s correlation coefficients between different environmental
factors. The stars in the heatmap indicate significance levels: \*
(P < 0.05), \*\* (P < 0.01), and \*\*\* (P < 0.001). All
statistical tests were two-tailed.